转: http://marcioandreyoliveira.blogspot.jp/2008/03/how-to-debug-striped-programs-with-gdb.html
My friend Wanderley asked me if it is possible to tell GDB to load debuging symbols from some file and use it to help debuging a program that doesn’t have them.
Yes. It is.
There are two solutions to this question.
I going to explain the first solution in this post. The other solution I will explain in the next post.
You can load debuging information from an debug enabled version of executable file.
In order to better explain the first solution, I will setup my sample environment as follows:
- released.c: source code of the program we wish to debug (listing 1).
- ~/estudo/: Source code of our program will be put here.
- ~/local/bin: The stripped off version of binary program will stay here.
- ~/local/symbols: In this place are all files that contain debuging information.
|
1 2 3 4 5 6 7 8 9 10 11 12 13 14 15 16 17 18 19 20 21 22 23 24 25 26 27 28 29 30 |
#include <stdio.h> #include <stdlib.h> int division(int a, int b); int m; int main(void) { int i; int j; printf("vou setar i\n"); i = 10; printf("vou setar j\n"); j = 1; printf ("i = %d, j = %d\n", i, j); m = division(i, j); printf("m = %d / %d = %d\n", i, j, m); return 0; } int division(int a, int b) { return a / b; } |
I have two versions of the program: with and without debuging information.
1 – You compile your program with debug information. In our sample:
2 – You make a copy of your program. In our sample:
3 – You strip off debuging information:
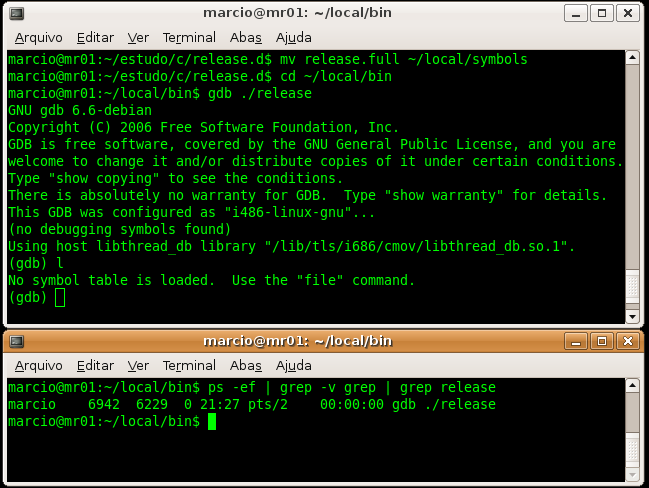
As you can see on Figure 1, we have two programs. released.full has debuging symbols but release doesn’t have them.
![[nosym_metodo1_fig1.png]](http://3.bp.blogspot.com/_f3tH_0i5uB0/R9MS6BmRJZI/AAAAAAAAC5M/mKqsw8e96dg/s1600/nosym_metodo1_fig1.png)
4 – Move file release to ~/local/bin/:
5 – Move file released.full to ~/local/symbols/
6 – Go to directory ~/local/bin
7 – Run GDB:
8 – Try list command to see that release executable file doesn’t have symbols in it.
Note: if the program was already running you could get its PID then attach GDB to it.
Figure 2 shows us two windows. The first one shows that our executable file has no debug information. In the other window we can see thatrelease is not yet loaded.
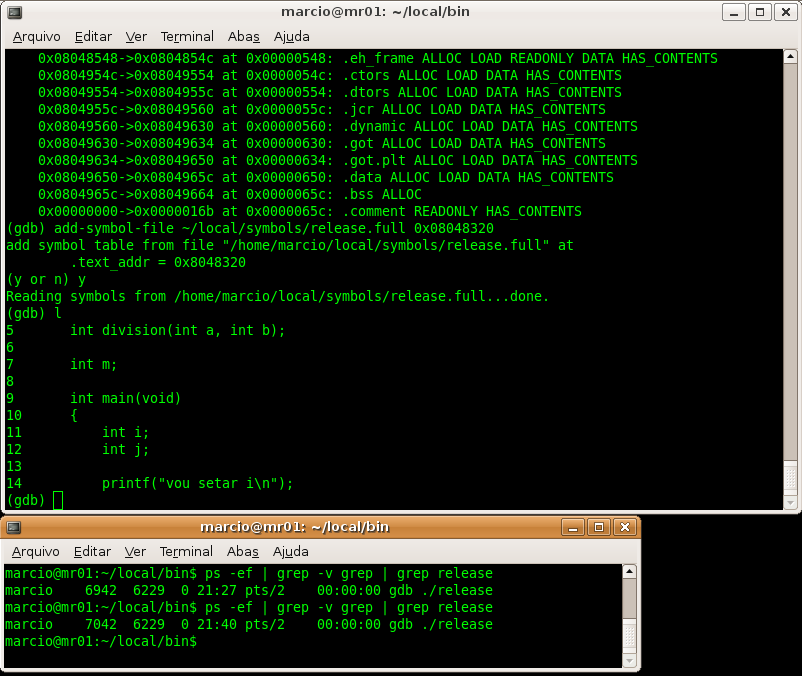
9 – Let GDB to load symbols from executable file named release.full. This binary version of our program has all symbols that we need to debug.
Please notice that GDB will not replace the release executable byrelease.full version of our program. It will just import symbols fromrelease.full into release debugging session.
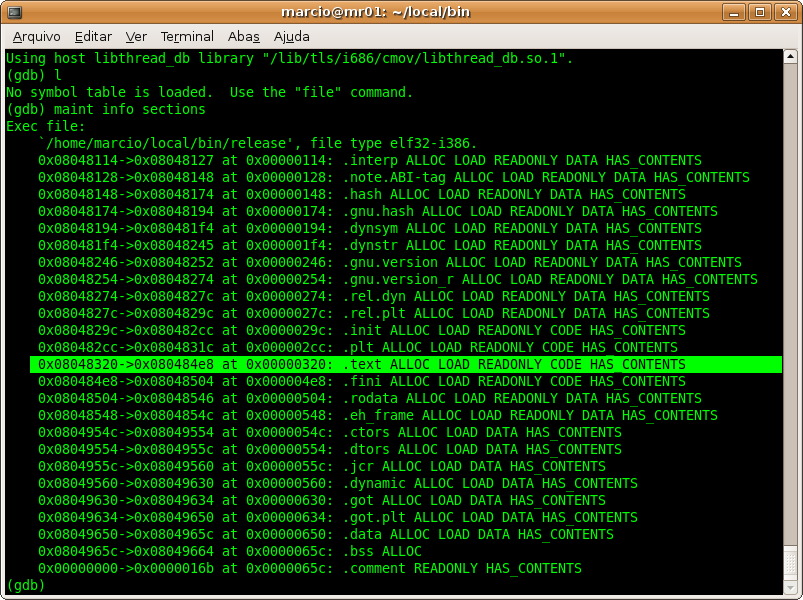
But GDB needs to know in advance where it must put the symbols it will load. How can you determine the correct memory address?
It is quite simple. You issue command maint inside GDB:
Then you look for .text section. The address that is in the first column is what you want. In our sample, it is 0x08048320. See figure 3.
10 – The next step is to instruct GDB to load debug symbols into .text section. To achieve it you do this:
In our sample it means to type:
From now on you can debug your program as usual.
Figure 4 shows us that debugging symbols where imported successfully and that now the list command (abbreviated as l) shows us the program source code.
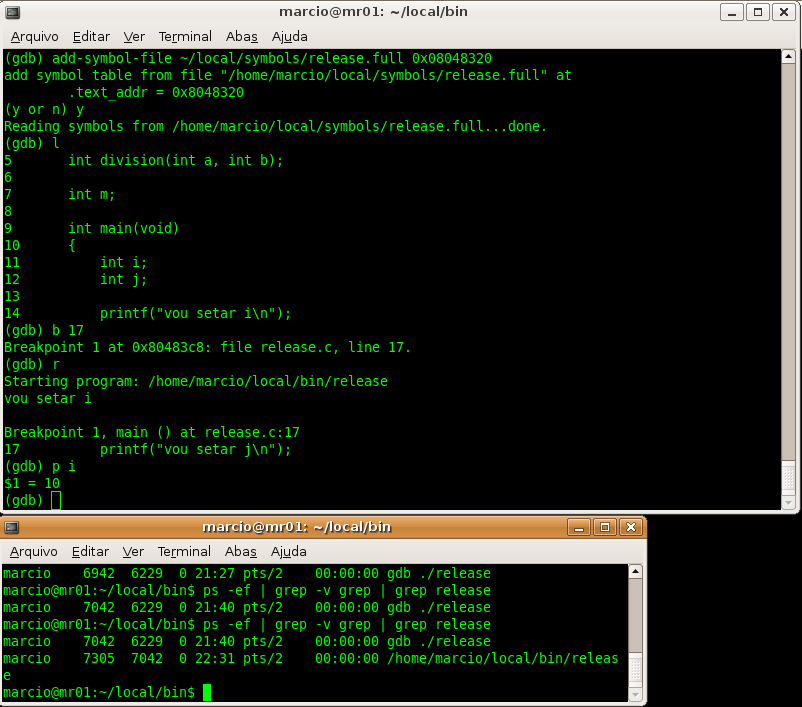
As you can see in figure 5, I set a break point at line 17 and I ran the program that stopped there. Then I printed i variable.
In the other terminal I issued ps command. It was done just to show you that the only program running was release executable. There is no instance of release.full program.
I hope this post will make your life easier. In the next time I will teach you another way to import debugging symbols.